Sharpe Ratio for Crypto Traders: The Ultimate Guide to Risk-Adjusted Returns
Is your crypto strategy winning? Use our guide to the Sharpe ratio for crypto traders to measure risk-adjusted returns and prove your edge in a volatile market.
June 27, 2026 · 16 min read
If your portfolio grew by 40% last year but you suffered through 70% drawdowns to get there, are you actually winning? In the high-stakes world of digital assets, returns mean nothing without the context of the volatility you endured to earn them. Many participants confuse a lucky streak during a pump with a sustainable edge. Mastering the sharpe ratio for crypto traders is the single most important step in moving from emotional gambling to elite performance tracking.
We know the constant swings of the 2026 market create immense pressure. It is difficult to feel confident in your strategy when you are unsure if your gains are just a byproduct of luck. This guide promises to demystify complex financial formulas and give you a clear Health Score for your trading. You will learn how to protect your capital by benchmarking against the current 3.70% risk-free rate while reducing drawdowns without sacrificing your upside.
We will explore how to calculate your risk-adjusted returns, analyze why Bitcoin and Ethereum ratios have diverged recently, and show you how to build professional-grade performance reports that prove your strategy has what it takes to last.
Key Takeaways
- Move beyond vanity metrics by learning to measure excess return per unit of volatility for a truer picture of your trading success.
- Master the sharpe ratio for crypto traders to benchmark your performance against the current risk-free rate and filter out market noise.
- Identify the "Crypto Trap" where traditional formulas might misinterpret your biggest gains as negative risk factors due to high volatility.
- Implement refined position sizing and disciplined stop-loss rules to lower your standard deviation without capping your profit potential.
- Leverage an Automated Trading Journal to generate instant Account Performance Reports that reveal the true longevity of your strategy.
Table of Contents
The Crypto Trap: Why a 'Good' Sharpe Ratio Can Be Misleading
Automating Your Analytics: Clarity with Insyte Performance Reports
What is the Sharpe Ratio? Why Crypto Traders Need It Now
Raw ROI is a lie that keeps many participants trapped in a cycle of high stress and ultimate ruin. A 80% return sounds impressive on social media, but if you had to endure a 70% drawdown to get there, your strategy is statistically fragile. Compare that to a trader earning 50% with only a 10% maximum drawdown. The second trader isn't just "safer"; they are objectively more skilled. This is where the sharpe ratio for crypto traders becomes the ultimate signal in a market drowning in noise.
At its simplest level, What is the Sharpe Ratio? It is a mathematical formula used to understand the amount of excess return you receive for the extra volatility you endure by holding a risky asset. In the crypto markets of 2026, where flash crashes and regulatory shifts remain common, this metric acts as a Health Score for your account. It tells you if your gains are the result of a repeatable edge or just a lucky series of coin flips.
The Core Components: Return, Risk, and the Risk-Free Rate
To master this metric, you must look beyond your total profit. The calculation starts with your "Excess Return," which is your total gain minus the risk-free rate. As of June 2026, the 3-month U.S. Treasury Bill rate sits at 3.70%. This is your baseline. If your crypto strategy isn't significantly outperforming this "guaranteed" return, you are taking massive risks for rewards you could have found in a savings account.
The second piece is the Standard Deviation. This measures the "rollercoaster" nature of your equity curve. High standard deviation means your account balance swings wildly from day to day. A high-performance sharpe ratio for crypto traders balances these two forces, proving that you can grow capital without constant, gut-wrenching volatility. It provides the psychological relief of knowing your strategy is built on data, not just hope.
Why Traditional Finance Metrics are Moving to Crypto
The asset class matured rapidly following the SEC and CFTC jurisdictional split in early 2026. Crypto is no longer the Wild West; it is a sophisticated financial frontier. Institutional traders and hedge funds now use the Sharpe Ratio as a primary filter to vet strategies. They don't care about "moon bags." They care about consistency.
Adopting this mindset transforms you from a gambler into a true portfolio manager. By focusing on risk-adjusted returns, you align yourself with the pros. You stop chasing every pump and start refining your execution. Modern tools like Account Performance Reports now make these insights accessible, allowing you to see the professional-grade data that was once reserved for Wall Street desks. This shift in perspective is the first step toward long-term survival in the digital asset space.
Decoding the Math: How to Calculate Your Sharpe Ratio
Calculating the sharpe ratio for crypto traders doesn't require a PhD. It requires precision. The formula is straightforward: (Portfolio Return - Risk-Free Rate) / Standard Deviation. With the 3-month U.S. Treasury Bill rate at 3.70% as of June 2026, your baseline is higher than in previous years. This subtraction is vital. It isolates the profit you earned through actual trading skill rather than what you would have gained by simply sitting on cash.
Annualizing this data is where most traders trip up. Crypto markets never sleep. Unlike the 252 trading days in the stock market, digital assets require a 365-day adjustment. A daily Sharpe ratio of 0.1 might look small, but when annualized, it can reveal a powerhouse strategy. Spreadsheets often fail here. They struggle to handle high-frequency data and the 24/7 nature of the market. Don't guess. Measure with intent.
Benchmark Levels for Crypto Traders
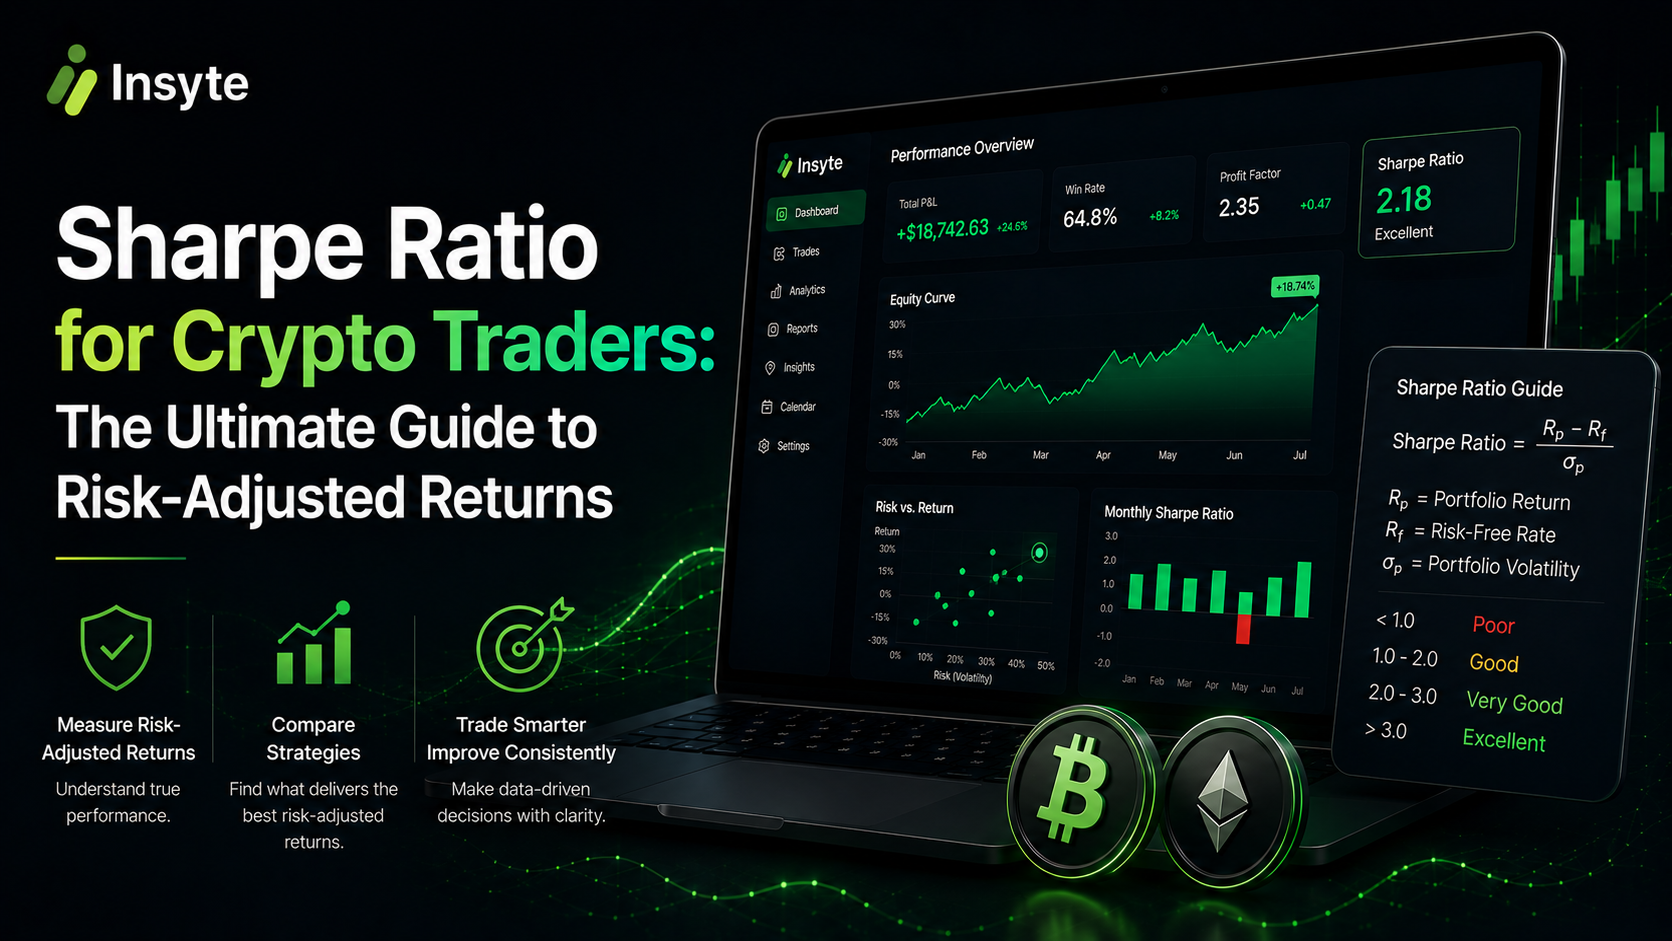
What does a "good" number actually look like? In traditional finance, a ratio above 1.0 is considered acceptable. In the high-volatility world of crypto, the benchmarks are more nuanced:
Under 1.0: This signals sub-optimal risk management. You're likely experiencing high-stress drawdowns for mediocre gains.
1.0 to 2.0: This is professional grade. It proves you have a clear, repeatable edge that survives market swings.
3.0+: Exceptional performance. These numbers are typically reserved for elite high-frequency bots or market makers.
The Impact of Timeframes
Your trading style dictates your volatility profile. Scalpers deal with micro-fluctuations that can lead to a very high Sharpe ratio if execution is flawless. Swing traders must weather larger price swings over days or weeks. This naturally lowers the ratio even if the strategy is highly profitable. Consistency over time is the real goal.
Beware of look-ahead bias when reviewing your data. This occurs when you use information from the future to justify past trades in your records. It creates a "perfect" ratio that doesn't exist in live markets. While the math seems absolute, remember that The Crypto Trap: Why a 'Good' Sharpe Ratio Can Be Misleading highlights how non-normal distributions in crypto returns can skew these numbers.
The best way to avoid these calculation errors is to stop relying on manual entry. Use Account Performance Reports to automate the heavy lifting. This ensures your sharpe ratio for crypto traders is calculated in real-time using every tick of data. It gives you a true reflection of your performance without the spreadsheet headache.
The Crypto Trap: Why a 'Good' Sharpe Ratio Can Be Misleading
The sharpe ratio for crypto traders is a powerful tool, but it has a massive blind spot that can punish your best performance. It treats all volatility as "bad." In a market where a 20% candle to the upside is the goal, the standard formula penalizes that growth just as much as a 20% crash. This is the Volatility Paradox. You might find yourself with a lower ratio simply because your winning trades were too large.
To understand why this happens, it is helpful to look back at William F. Sharpe's foundational paper on the ratio. The original intent was to measure risk in balanced portfolios, not necessarily hyper-growth assets like digital commodities. The math assumes a "normal distribution" of returns, where extreme outliers are rare. We know crypto is anything but normal.
Crypto returns are notorious for "fat tails" or black swan events. A strategy can produce a "good" ratio for months by picking up small gains, only to be wiped out by a single liquidity crunch. In 2026, where the bid-ask spread on less common altcoins can exceed 3%, these hidden costs often trigger massive slippage during volatility. One bad day can ruin a year of "consistent" data. This skewness problem means you could be winning small 90% of the time but losing everything in the remaining 10%.
Sharpe vs. Sortino: Which One Should You Track?
If you want a metric that doesn't punish your wins, look at the Sortino Ratio. While the sharpe ratio for crypto traders uses total standard deviation, the Sortino only looks at downside deviation. It ignores the "good" volatility of your moon shots and focuses solely on the moves that hurt your capital. Downside deviation is the only true enemy of the crypto trader. Use Sharpe to measure your general consistency, but rely on Sortino to understand your true growth potential.
Identifying 'Fake' Sharpe Ratios
Some strategies produce artificially high metrics that mask catastrophic risk. Selling naked options or "picking up pennies" in front of a steamroller results in a perfect equity curve until the steamroller arrives. Low-volume altcoins can also distort your data. If you are trading pairs with massive spreads, your paper gains might look stable, but your actual realized Sharpe will be much lower due to exit friction. High leverage further complicates this by compressing your margin for error, making a "good" ratio look safe right up until the moment of liquidation.
4 Ways to Improve Your Sharpe Ratio and Stabilize Growth
Improving the sharpe ratio for crypto traders is not just about finding better entries. It is about aggressively managing the denominator of the equation: your volatility. High returns are easy to find in a bull market, but keeping them requires a systematic approach to risk. By refining your habits, you can transform a volatile equity curve into a steady upward climb.
Refine Position Sizing with the Kelly Criterion: Stop guessing your trade size. Use the Kelly Criterion to determine the mathematically optimal percentage of your capital to risk based on your win rate and reward-to-risk ratio. This prevents the over-leveraging that leads to account-killing drawdowns.
Tighten Stop-Loss Discipline: Your ratio improves when you reduce the standard deviation of your losses. Large, unexpected outliers are the primary enemy. By strictly adhering to stop-losses, you ensure that every loss fits within a tight, predictable range, which stabilizes your performance metrics.
Diversify Asset Correlation: Many traders think they are diversified because they hold ten different altcoins. In the 2026 market, most assets still move in lockstep with Bitcoin. True diversification means trading assets with lower correlation, such as mixing Layer 1s with DeFi protocols or AI-sector tokens, to smooth out your total portfolio volatility.
Implement Time-Based Stops: Capital that isn't moving is capital at risk. If a trade hasn't hit your profit target or stop-loss within a specific window, close it. This reduces your "time-at-risk" and prevents you from being caught in a sudden market-wide flush while your capital is stagnant.
Optimizing Your Execution Pattern
Success often leaves a trail in your data. Using Account Pattern Analysis allows you to identify specific hours or days where your performance dips. Many traders suffer from "Tilt" trades after a loss, which causes a massive spike in downside deviation. Eliminating these emotional errors is the fastest way to stabilize your growth. Focus on consistency. A string of base hits will always outperform a "home run" strategy that carries a high risk of striking out. Clarity comes from seeing exactly where your execution fails.
Risk Management as a Profit Driver
Reducing risk is not about being timid; it is about maximizing compounding. A smaller drawdown means you need less profit to return to new all-time highs. Setting a "Max Daily Drawdown" protects your sharpe ratio for crypto traders by forcing you to walk away before a bad day turns into a catastrophic one. Use data-driven insights to recognize low-volatility regimes where overtrading only leads to "death by a thousand cuts" through fees and spreads.
Stop fighting the math and start using it to your advantage. You can access your Trading Health Score today to see exactly which habits are dragging down your risk-adjusted returns and where you have the most room to optimize.
Automating Your Analytics: Clarity with Insyte Performance Reports
Manual journaling is the graveyard of trading discipline. It is slow. It is inaccurate. Most participants stop tracking metrics because the friction is too high. This is exactly why the sharpe ratio for crypto traders remains a mystery to the average retail participant. You cannot optimize what you do not measure. In a market that moves at light speed, automation is the only way to maintain a professional edge.
Insyte removes the friction entirely. Our Automated Trading Journal calculates your Sharpe and Sortino ratios in real-time as you trade. There are no complex formulas to memorize. There are no broken spreadsheets to fix. You receive a clear Trading Health Score that reflects the true pulse of your strategy. This isn't just a number. It is actionable intelligence. By using our Ticker Analyzer, you can pinpoint exactly which asset is killing your ratio. Perhaps your Bitcoin trades are professional grade, but a specific altcoin is introducing unnecessary volatility. Insyte shows you the truth.
The Insyte Advantage: Beyond the Spreadsheet
Precision requires clean data. Insyte features automatic exchange sync to eliminate manual entry errors and save time. You get a direct pipeline from your trades to your analytics. Our Account Performance Reports provide a high-tech visualization of your equity curve and risk metrics. This allows you to identify Account Pattern Leaks that traditional formulas often miss. Through detailed Account Pattern Analysis, you might discover that your risk-adjusted returns plummet during specific high-volatility news events or late-night sessions. Identifying these patterns is the key to protecting your capital in 2026.
Your Path to Professional Mastery
The difference between a hobbyist and a professional is the quality of their feedback loop. Stop guessing whether your last win was skill or luck. Start executing based on hard performance data. A high Trading Health Score is more than just a personal metric. It is a badge of expertise. You can share your professional-grade performance reports to prove your edge to potential investors or partners with absolute confidence.
The transition from a lucky gambler to an elite trader starts with the right tools. Don't let your hard-earned gains disappear through poor risk management or a lack of oversight. Take control of your data and refine your edge. Optimize your trading strategy with Insyte’s automated analytics today.
Master Your Edge and Trade with Confidence
Raw profit is a vanity metric; risk-adjusted performance is the reality of professional trading. You now have the framework to separate market noise from a genuine competitive advantage. By mastering the sharpe ratio for crypto traders, you've moved beyond the emotional rollercoaster of high volatility and into a world of data-driven clarity. You understand how to refine your position sizing, tighten your discipline, and use advanced metrics like the Sortino ratio to protect your capital.
Consistency is the ultimate goal in the 2026 market. You don't have to battle complex spreadsheets or manual logs to get there. Leverage an Automated Trading Health Score and real-time Account Performance Reports to see your progress instantly. Use the AI-driven Ticker Analyzer to identify exactly which patterns are fueling your growth and which are draining your account.
The path to elite performance is open. Stop guessing and start scaling-Analyze your Sharpe Ratio with Insyte now. Your future self will thank you for the discipline you build today. Let's get to work.
Frequently Asked Questions
What is a good Sharpe ratio for a crypto trader?
A ratio of 1.0 is the standard benchmark for professional performance. In the volatile digital asset markets of 2026, anything between 1.0 and 2.0 indicates a clear, repeatable edge. Ratios above 3.0 are exceptional and usually found in high-frequency bot strategies or specialized market-making accounts. If your score is consistently below 1.0, your risk management likely needs refinement.
Can a Sharpe ratio be negative in crypto?
Yes, and it is a common signal of poor market conditions. In May 2026, Bitcoin’s annualized ratio turned negative, indicating that its returns failed to compensate for its risk compared to the 3.70% risk-free rate. A negative value means you are better off holding cash or Treasury bills than continuing with your current trading strategy.
How often should I calculate my trading Sharpe ratio?
Monitor your metrics daily but focus on monthly and quarterly trends for strategic decisions. Daily snapshots in crypto are often too noisy due to 24/7 market swings. A rolling 30-day average provides a much more accurate Health Score. Automated tools provide this data in real-time, allowing you to spot performance decay before it drains your capital.
Does the Sharpe ratio account for crypto exchange fees?
The ratio only accounts for fees if you use net returns for the calculation. With standard maker/taker fees ranging from 0.04% to 0.25% in 2026, ignoring these costs will artificially inflate your performance metrics. High-frequency traders must be especially careful. Small, unrecorded costs like bid-ask spreads and withdrawal fees can turn a statistically "good" strategy into a losing one.
Why is my Sharpe ratio low even though I am making money?
Your ratio is likely low because your strategy experiences high "upside volatility." The standard formula for the sharpe ratio for crypto traders penalizes all price swings, even the ones that result in profit. If your account balance jumps 20% in a single day, the math views that instability as a risk factor. This is why many pros use the Sortino ratio alongside it.
What is the difference between Sharpe and Sortino ratios for Bitcoin traders?
The Sharpe ratio measures total volatility, while the Sortino ratio only penalizes downside moves. For Bitcoin traders, the Sortino ratio is often a more practical metric. It ignores the massive upward surges that are common in crypto bull runs and focuses solely on the drawdowns that actually threaten your account longevity. It tells you if your "bad" volatility is under control.
Can automated trading journals like Insyte calculate this for me?
Yes, an Automated Trading Journal removes the need for manual math or complex spreadsheets. These tools sync directly with your exchange to pull trade data and generate real-time Account Performance Reports. You get an instant Trading Health Score that updates with every closed position. This automation ensures your risk metrics are always accurate and based on the latest market data.
How does leverage affect my Sharpe ratio?
Leverage almost always lowers your ratio because it increases volatility faster than it increases net profit. While a 5x or 10x position can lead to larger wins, it also creates massive swings in your equity curve. This higher standard deviation makes your strategy appear less stable. Professional traders often find that reducing leverage actually improves their risk-adjusted returns over the long term.
← Back to all posts