analyze trading direction bias
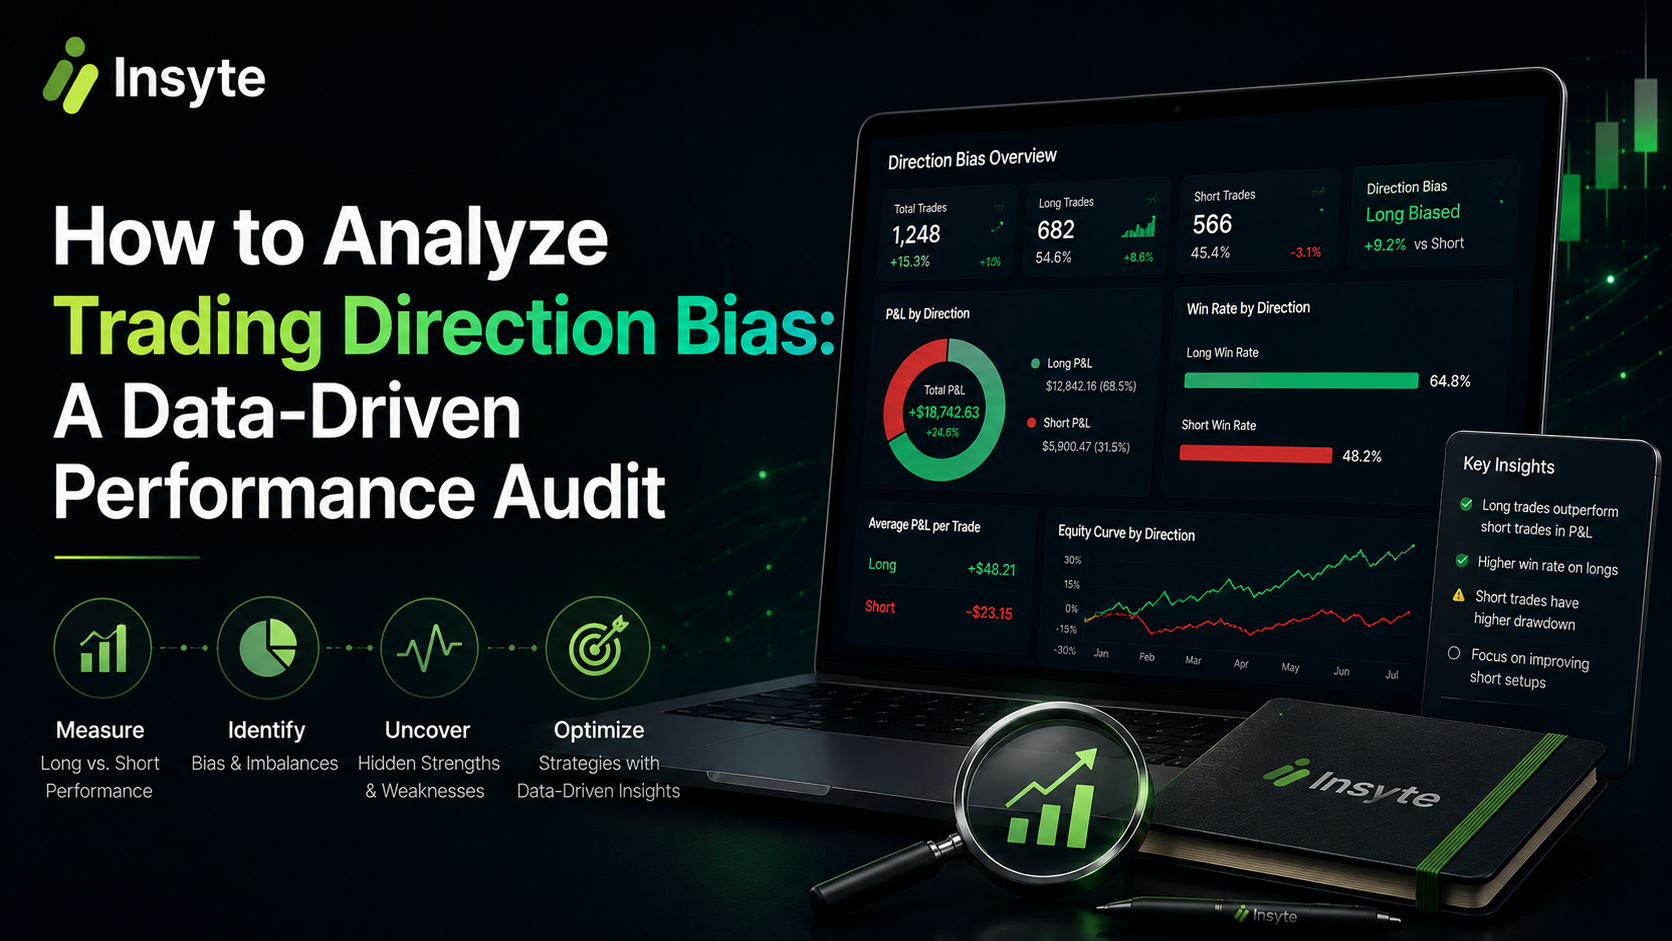
How to Analyze Trading Direction Bias: A Data-Driven Performance Audit
Stop losing money on one side of the market. Learn to analyze trading direction bias with a 4-step framework to find your true edge and boost profitability.
June 24, 2026 · 15 min read
73% of traders are unable to identify their worst-performing symbol without specialized tools. Even more alarming is the number of traders who don't realize they're losing money on short positions while winning on longs. It's easy to feel "married" to a specific market direction. You might wonder if your strategy is failing or if you've simply developed a blind spot. To fix this, you must learn to analyze trading direction bias through the lens of hard data rather than intuition.
We understand the frustration of watching your hard-earned gains from one side of the market evaporate on the other. It's a common performance leak that stays hidden until you audit your historical execution. This article promises to give you the clarity you've been missing. You'll learn how to uncover these leaks by auditing your long and short performance using modern analytics.
We'll provide a clear framework for identifying your specific "side" edge. By the end, you'll have the actionable intelligence needed to balance your execution and improve your win rate. It's time to transition from confusion to a sophisticated, data-driven mastery of the markets.
Key Takeaways
- Distinguish between market bias and execution bias to pinpoint if your strategy or your mindset is leaking profit.
- Follow a 4-step framework to analyze trading direction bias and identify which side of the market holds your true competitive edge.
- Learn why a minimum sample of 30-50 trades is essential to separate genuine execution trends from temporary market noise.
- Decode your trading profile to see if you are a "Bull Market Rider" or if you've fallen into the "Contrarian Trap."
- Eliminate manual tracking by using an Automated Trading Journal to categorize your long and short performance instantly.
Table of Contents
What is Trading Direction Bias and Why Does it Matter?
Trading direction bias is more than a simple market opinion. It's a systematic preference for one side of the market, often operating beneath your conscious awareness. You might find yourself favoring long positions even when the trend turns sour. Or perhaps you're a "permabear" looking for a crash that never comes. This isn't just about reading charts; it's about your internal wiring and how it translates into profit or loss. To truly improve your results, you must learn to analyze trading direction bias by looking at your actual results rather than your intentions.
Most traders confuse market bias with execution bias. Market bias is what you see on the screen. It's the analysis of price action, volume, and indicators. Execution bias is what your trade history says. It's the hard truth of your wins and losses. You might think you're a neutral trader, but your data could tell a different story. If you ignore this, you're likely suffering from "Bull Market Genius" syndrome. This happens when a strong uptrend hides your inability to short the market effectively. It inflates your ego while your actual skill set remains lopsided. This imbalance creates friction in your performance, dragging down your Sharpe Ratio and compromising your overall account health.
The Two Faces of Bias: Technical vs. Psychological
Technical bias is often helpful. It involves using High Time Frame (HTF) structures to find trend confluence. You're looking for a logical reason to enter. However, this easily bleeds into psychological bias. This is the "permanent bull" or "permanent bear" mentality. When these two interact, they create massive performance blind spots. You start ignoring red flags because of Confirmation Bias, convincing yourself that the trend will last forever. You stop trading the chart and start trading your ego. This prevents you from seeing the market clearly and leads to missed opportunities on the "other" side of the trade.
The Cost of Ignoring Your Execution Data
Execution bias is the statistical discrepancy between your long and short performance. It's the proof that you're better at one side than the other. Why does this matter? "Guessing" your bias leads to overtrading in unfavorable conditions. You might take shorts in a raging bull market because you "feel" a reversal is coming. This directional imbalance directly impacts your drawdown depth. Without a data-driven audit, your account health remains at the mercy of your subconscious preferences. You need to analyze trading direction bias to stop the bleeding and start optimizing for actual performance.
Identifying Directional Leaks in Your Trading History
Identifying a directional leak requires more than a gut feeling about your last few trades. Some suggest looking at your last five entries; this is a mistake. Five trades represent noise, not a pattern. To accurately analyze trading direction bias, you need a sample size of at least 30-50 trades. This volume filters out market variance and reveals your true execution habits. It's the difference between a bad afternoon and a systemic failure in your strategy.
The Long/Short Performance Split
Start by calculating your Win Rate for long positions versus short positions. A significant disparity often signals a deep-seated bias. For instance, if your long win rate is 65% but your short win rate is 35%, you aren't just "better" at longing. You're likely fighting the tape. Compare your Profit Factor as well. Are your wins on one side significantly smaller than the other? If your shorts are consistently "paper-handed" for tiny gains while your longs run to target, your psychology is overriding your system. You might be riding the trend on the way up but desperately trying to catch a falling knife on the way down.
Uncovering these patterns manually is tedious and prone to error. High-performance traders use Account Performance Reports to visualize these gaps instantly, turning raw data into actionable intelligence.
Hold Time and Stress Metrics
Data-driven audits go beyond simple win rates. You must examine the "Stress Factor" of your trades. This metric tracks how deep into drawdown your positions go before hitting profit or a stop. If your short positions consistently experience deeper drawdowns than your longs, it indicates poor entry timing or a refusal to accept bearish momentum. You're likely entering shorts too early, hoping to top-tick the market. It's a classic sign of fighting the prevailing trend.
Hold time analysis is equally revealing. Are you cutting shorts significantly earlier than longs? This often stems from discomfort. Psychological bias makes shorting feel "unnatural" for many, leading to premature exits that ruin your risk-to-reward ratio. Identifying these metrics helps you determine if your bias is situational, perhaps tied to current market conditions, or chronic, meaning it's a permanent flaw in your execution. To effectively analyze trading direction bias, you must look at how you behave under pressure, not just the final PnL.
How to Analyze Trading Direction Bias: A 4-Step Audit
Most traders spend hours on technical analysis to pick a market direction. Very few spend minutes auditing if they can actually execute in that direction. This is the gap between theory and profit. To effectively analyze trading direction bias, you must move beyond the "why" and focus on the "what." It's about auditing your history to see where your strategy actually thrives. This 4-step audit transforms raw trade history into actionable intelligence.
Step 1 & 2: Data Aggregation and Categorization
The foundation of any audit is clean data. Step 1 requires you to export your trade history from your exchange, whether it's Binance, Bybit, or Coinbase. This is your raw performance record. Step 2 is segregation. You must separate every entry into Long and Short categories. Without this split, your overall win rate is a misleading average that hides your specific weaknesses.
Data hygiene is critical here. You must remove outliers, fat-finger errors, or one-off "test" trades that don't represent your core system. These anomalies skew your metrics and camouflage systemic leaks. Manual spreadsheets often fail during this process. They struggle to capture execution nuances like partial fills or the true impact of "hedged" positions. If you trade hedged, categorize those positions based on their primary intent. Clear, segregated data is the only way to see the reality of your execution habits.
Step 3 & 4: Quantitative Comparison and Benchmarking
Step 3 involves calculating the core metrics for each bucket: Win Rate, Profit Factor, and Max Drawdown. This is where the leaks become visible. A 20% gap in win rate between sides indicates a structural bias leak that is draining your capital. It's a clear signal that your execution is lopsided, regardless of what the charts say. You might be a great trader on paper but a biased one in practice.
Step 4 is the ultimate reality check: benchmarking. Compare your results against the market trend for that specific period. Did you lose money on shorts while the market was crashing? This is a major red flag. It suggests you're fighting the market even when the trend is in your favor. To finish the audit, calculate your "Side-Specific Expectancy" for both categories. This formula reveals the exact dollar value of every Long versus every Short you take. When you analyze trading direction bias with this level of precision, you gain a massive competitive advantage. You stop guessing and start optimizing for the side where your true edge lies.
Interpreting the Results: What Your Data is Screaming
Your audit is complete. The numbers are in front of you. Now comes the critical part: listening to what your data is screaming. When you analyze trading direction bias, you aren't just looking for mistakes. You're identifying your trader archetype. Your history reveals the difference between a calculated strategy and a subconscious habit. It's time to stop guessing and start reacting to the reality of your execution.
Many traders discover they are "Bull Market Riders." They boast a high win rate on longs but suffer near-zero capability on the short side. This isn't a balanced edge; it's a reliance on market tailwinds. Conversely, the "Contrarian Trap" involves constantly shorting strength and longing weakness. This trader is addicted to calling tops and bottoms, usually at the expense of their account balance. Your data will show if you're fighting the tape or riding it. If your Profit Factor on one side is below 1.0 while the other is above 2.0, you have a structural leak that needs immediate attention.
Distinguishing between a bad strategy and a bad bias is vital. If your system works on longs but fails on shorts even during a market correction, the problem is you, not the strategy. You can monitor this alignment in real-time using a Trading Health Score to ensure your actions match your analysis.
Scenario A: The One-Sided Specialist
If you only win on longs, should you stop shorting? In the short term, leaning into your bias can save your account. If the data says you're a long specialist, stop wasting capital on low-probability shorts. However, being a one-sided specialist is risky. Market regimes change. A strategy that only works in an uptrend will eventually fail. Instead of quitting shorts entirely, use your audit to slowly build competence. Reduce your position size on your weak side. Treat those trades as data-gathering missions until your metrics improve.
Scenario B: The Directional Mismatch
The directional mismatch is a psychological disconnect. It happens when you see a bearish setup on the charts but click "buy" anyway. You're trading your hope rather than the price action. Closing the gap between what you see and what you do is the path to mastery. Start by adjusting your risk parameters based on your directional edge. If your data shows a 20% lower win rate on shorts, your risk per trade on shorts should be significantly lower. This data-driven approach removes emotion and forces you to analyze trading direction bias as a measurable performance metric.
Automating Bias Analysis with Insyte’s Analytics
Manual journaling is a grind. It's often the enemy of objective analysis because you're prone to skip logging the trades that hurt the most. This is where an Automated Trading Journal changes the game. It pulls data directly from your exchange, categorizing Long and Short entries instantly. You get a clean, unbiased look at your history without the friction of manual data entry. To effectively analyze trading direction bias, you need a system that removes human error from the equation.
Beyond simple logging, you must see the hidden patterns in your behavior. Account Pattern Analysis identifies directional leaks as they occur. It flags when you're overtrading one side of the market or repeatedly fighting a dominant trend. When you combine this with the Ticker Analyzer, you can see which specific assets favor your current execution style. Stop shorting volatile assets that consistently trend against you. Start longing the ones where your data proves you have a statistical edge.
Clarity Through Automation
Recency bias is a silent account killer. Most traders focus on their last three losses and ignore the larger trend. Automation forces you to look at the full statistical picture. It eliminates the emotional weight of a bad afternoon by showing you the long-term reality. You can watch your Trading Health Score improve in real-time as you balance your bias. It's the ultimate feedback loop. You move from guessing to knowing, gaining the confidence to size up when the data confirms your edge.
Your Path to Data-Driven Mastery
Professional traders don't go hunting for more indicators. They prioritize performance analytics over everything else. They know that understanding their own execution is the only way to scale. You now have the framework to analyze trading direction bias with surgical precision. It's time to transform your raw exchange data into a high-performance execution strategy. Stop letting hidden biases drain your capital and start trading with the clarity of an automated audit.
Sign up for Insyte to audit your trading direction bias today.
Eliminate Your Directional Blind Spots
You've seen how directional bias functions as a silent performance leak. It's the difference between scaling a winning system and bleeding capital on low-probability setups. By moving through a data-driven audit, you've gained the tools to identify your specific execution profile. When you analyze trading direction bias, you replace gut feelings with statistical certainty. This transition from confusion to clarity is where your real competitive advantage begins.
Refinement is faster when it's automated. Insyte offers real-time Trading Health Scores and automated pattern detection to keep your long and short execution in balance. With seamless support for major crypto exchanges via API, the path to mastery is ready for you. Stop guessing and start auditing; connect your exchange to Insyte now.
Take control of your execution today. Your data already holds the answers to your next performance breakthrough. You just need the right tools to listen. Trade with confidence and let the numbers lead the way.
Frequently Asked Questions
Is it better to be a long-only trader or trade both directions?
It depends entirely on your documented edge, though trading both directions provides more opportunities across different market cycles. Long-only traders often find themselves sidelined during extended bear markets. However, if your data proves a massive profit factor on one side, specialization is often more profitable than forcing trades where you have no statistical advantage.
How does recency bias affect my trading direction?
Recency bias causes you to overweight your most recent outcomes when making new decisions. If your last few shorts were stopped out, you might hesitate to take a perfectly valid bearish setup later that day. To overcome these emotional swings, you must analyze trading direction bias over a larger sample of at least 30 trades to see the objective truth.
Can a trading journal really help me identify directional bias?
An Automated Trading Journal is the most effective tool for uncovering execution patterns that aren't visible on a price chart. While charts show market movement, your journal shows your actual behavior. It provides a brutal but necessary look at your long versus short performance by removing the temptation to "forget" losing trades that don't fit your preferred narrative.
What is the most important metric for measuring directional edge?
Profit Factor per side is the gold standard for measuring your directional edge. It compares gross profit to gross loss for longs and shorts separately. A Profit Factor above 1.5 on one side and below 1.0 on the other is a clear signal of a structural leak. This metric tells you if your wins are actually covering your losses on that specific side.
How often should I audit my trading direction performance?
You should perform a deep audit every 30 to 50 trades or at the end of every trading month. Frequent audits help you catch "Bull Market Genius" syndrome before a market regime change wipes out your gains. Regular reviews ensure your execution stays aligned with current volatility rather than becoming stagnant or outdated.
What should I do if my data shows I am terrible at shorting?
Immediately reduce your risk on short positions or stop taking them until you refine your strategy. Professional traders often lean into their strengths while slowly building competence on their weak side. Use your Account Performance Reports to set strict rules, such as only taking shorts with a reduced position size until your win rate stabilizes.
Can I use Insyte to analyze my bias across different crypto exchanges?
Insyte currently supports Bybit, with Binance, OKX, and MT5 listed on the roadmap for future support. Centralizing your data in one place is crucial because your bias might change depending on the specific asset or exchange you're trading. This birds-eye view helps you analyze trading direction bias across your entire portfolio rather than in isolation.
How does directional bias differ from market trend?
Market trend is an objective observation of price action, while directional bias is your subjective preference for a specific side. You can correctly identify a bearish market trend but still possess a long bias that prevents you from clicking the "sell" button. Identifying this disconnect is the first step toward improving your win rate and balancing your execution.
← Back to all posts